Dynamic variography tools aid resource estimation
Variography is an essential component of resource estimation. It allows geologists to gain a greater understanding of the spatial correlation between geological information gathered predominantly from drillholes.
Discrete data points collected generally represent less than a billionth of the total volume someone is trying to estimate, so an  understanding of variography allows more informed control of the interpolation process used to fill blocks modelled between the real data points.
The new Vulcan Data Analyser, part of Vulcan 10 which is set for release in March this year, makes variography faster and simpler. As part of the global development team guiding the evolution of Vulcan Data Analyser I was keen to ensure the application met the needs of Maptek customers.
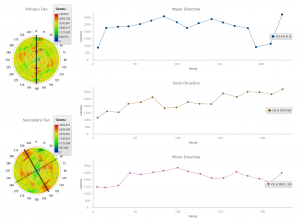
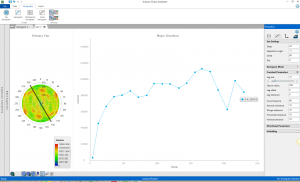
Vulcan Data Analyser brings together the functionality of 14 previous Vulcan menus into a single application with a new, easy-to-use interface. Variograms are quickly generated and for the first time, Vulcan users can dynamically update changes to parameters such as lag, azimuth and plunge.
Users can preserve variogram parameters, run different types of models and view multiple attributes on the same variogram to explore the correlation between different materials.  Multiple variogram models are supported. These can be manually adjusted and tailored to generate the best representative model for export as .vrg files for use in Vulcan grade estimation.
We’ve consulted with customers throughout the development project to ensure we delivered an application which would make resource estimation simpler, save time and integrate with their geological workflow in Vulcan.
After one customer meeting we introduced the ability to set fixed nugget and sill values, advanced zooming capabilities and interactive chart naming.
Feedback overall on the beta releases has been very positive. Comments include: ‘Looks like you will have some happy clients at this end with the new variography tools’ and ‘We are hanging out for it!!!’.
To learn more about what’s coming in Vulcan 10 visit: www.maptek.com/insight/vulcan10_preview.html


 understanding of variography allows more informed control of the interpolation process used to fill blocks modelled between the real data points.
 Multiple variogram models are supported. These can be manually adjusted and tailored to generate the best representative model for export as .vrg files for use in Vulcan grade estimation.